Why You Need a Helm's Eye
Down here on the St. Johns, I've learned that a good captain doesn't wait for the storm to hit. He watches the wind, feels the water, and knows the signs of a shift before the waves even crest. Same goes for your microservices.
When your latency spikes, your CPU hogs, or your error logs start filling up like a coffee mug after a long shift—that's your warning. The Helm's Eye is about spotting those early signs before your whole rig goes over.
The Dashboard Trinity
Every good helm needs three eyes on the water:
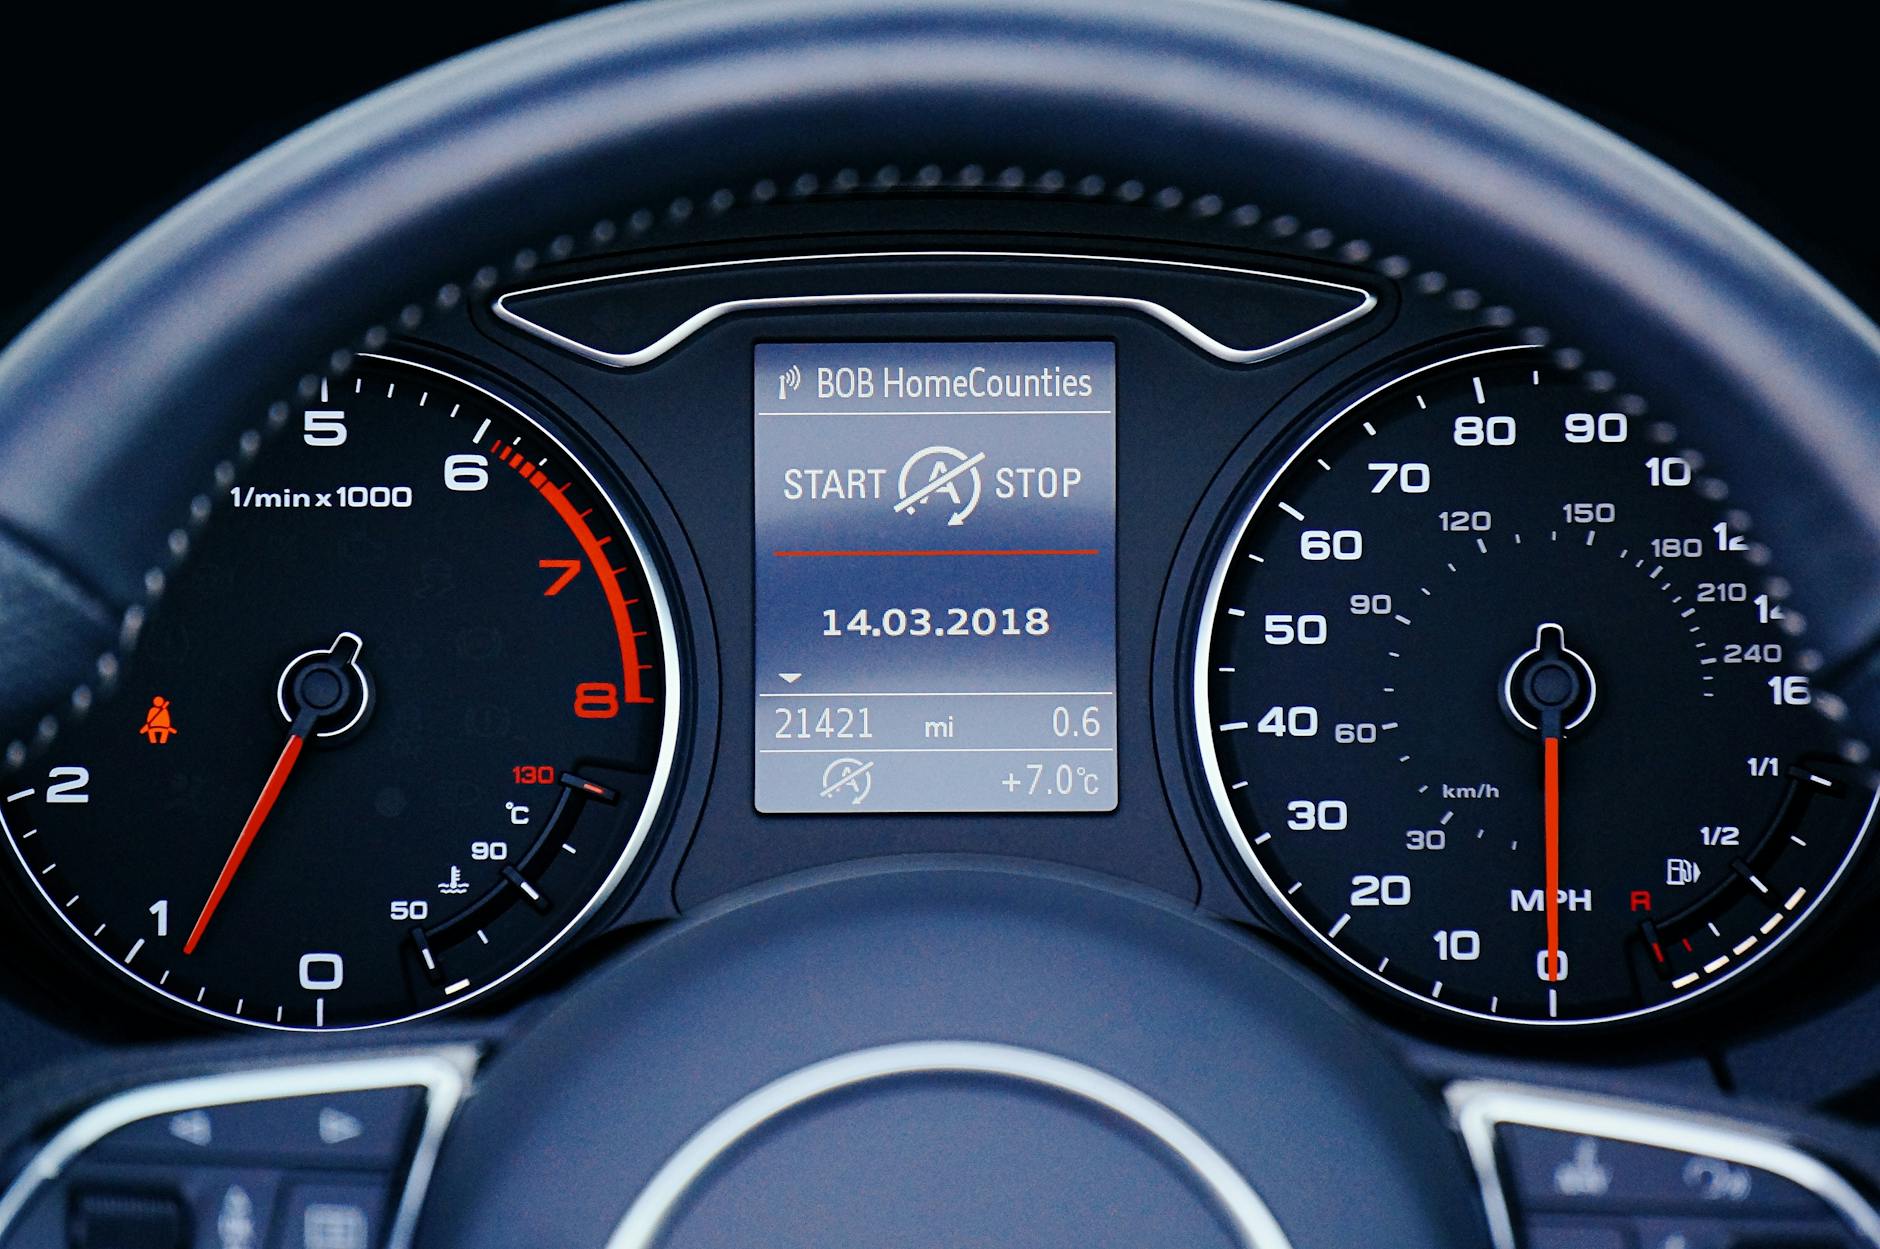
Latency Gauge: Watch your response times like a speedometer. If it's creeping up, you're losing ground.

CPU Tachometer: Your CPU load is your engine RPM. Too high, and you'll burn out. Too low, and you're not pushing hard enough.

Error Log Compass: Your error logs are your compass. They tell you which way the wind is blowing and where the shoals are.
When the Dunes Shift
Just like the dunes on the St. Johns can shift with the tide, your infrastructure can change without you noticing. That's why you need to keep a close eye on your metrics. A sudden spike in memory usage? That's a sandbar forming. A drop in throughput? That's the tide going out.
The Recovery Ritual
Even the best helm can't prevent every storm. But when the waves hit, you need a plan. That's where my "Sandbar Protocol" comes in. It's a 3-phase recovery method that's as reliable as a good knot.
Phase 1: Assess the Damage Don't panic. Check your logs, your metrics, and your gut. What broke? Why? And how bad is it?
Phase 2: Patch the Hole Get your emergency fixes in. Roll back the bad deploy, restart the service, or scale up if you need more horsepower.
Phase 3: Learn and Improve Once the storm passes, don't just move on. Learn from it. What could you do better next time? That's how you build resilience.
Want to see how I built the Sandbar Protocol? Check it out:
See the Sandbar Protocol